How Process Charts Simplify Complex Workflows and Boost Business Efficiency
When it comes to managing operations, improving productivity, or explaining complex procedures, a Process Chart is one of the most powerful visual tools available. Whether you're leading a team, presenting to stakeholders, or simply trying to understand a new system, a well-designed Process Chart can turn abstract steps into clear, actionable visuals.
What Exactly Is a Process Chart?
A Process Chart is a visual representation of a sequence of actions or decisions that make up a process. It typically uses standardized symbols—like rectangles for tasks, diamonds for decisions, and arrows to show direction—to map out how work flows from start to finish. This visual format makes it easier to identify inefficiencies, redundancies, and opportunities for improvement.
Unlike a simple list of steps, a Process Chart provides context. It shows not only what needs to be done but also who is responsible, when actions occur, and how they relate to one another. This level of clarity is especially valuable in dynamic environments where communication and alignment are key.
Real-World Applications of Process Charts
From healthcare to finance, manufacturing to marketing, Process Charts have become essential tools for streamlining operations and improving transparency. Here are some real-world examples of how different industries use them:
- Healthcare: Hospitals use Process Charts to map patient journeys, from admission to discharge. These charts help staff identify bottlenecks in care delivery and improve patient outcomes.
- Manufacturing: Assembly lines are often visualized using Process Charts to ensure each step is completed in the right order and that quality checks are integrated at the right stages.
- Finance: Financial institutions use Process Charts to outline loan approval workflows, ensuring compliance with regulations and reducing processing times.
- Marketing: Digital marketing teams rely on Process Charts to visualize campaign workflows, from content creation to ad placement and performance tracking.
Who Benefits from Using a Process Chart?
Anyone involved in planning, executing, or analyzing processes can benefit from a Process Chart. Here's a closer look at how different roles use them:
- Project Managers: Use Process Charts to outline project timelines, assign tasks, and monitor progress. Visualizing each phase helps keep projects on track and within scope.
- Operations Teams: Rely on Process Charts to standardize procedures, reduce errors, and ensure consistency across departments.
- Trainers and Educators: Use them to teach new employees or students how to perform specific tasks by walking them through each step in a logical sequence.
- Business Analysts: Analyze Process Charts to identify areas for automation, cost reduction, or process optimization.
Why Visual Tools Like Flow Arrows and Infographics Matter
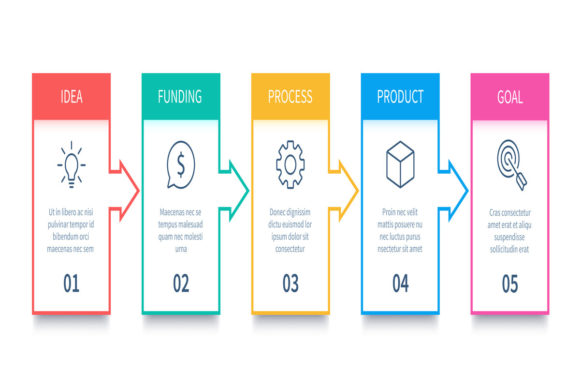
While a written process description can be informative, it often lacks the immediacy and clarity that visual tools provide. Flow arrows, decision points, and color-coded steps help viewers quickly grasp complex sequences. This is especially useful in presentations, training materials, or collaborative planning sessions.
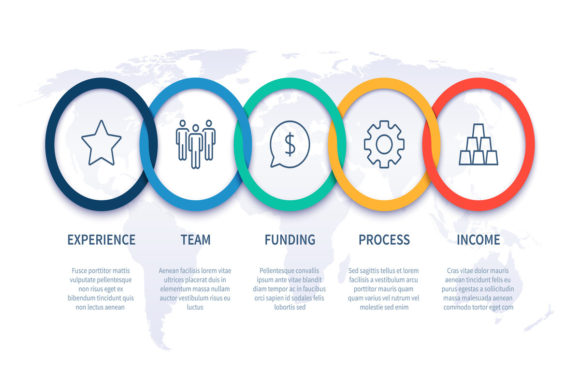
For example, a flow processes infographic can help a cross-functional team see how their roles connect in a customer service workflow. A business process step infographic might be used in a company-wide email to explain a new approval process in a way that's easy to digest.
When to Use a Process Chart Instead of Other Tools
There are many tools for visualizing information—flowcharts, Gantt charts, swimlane diagrams—but the Process Chart stands out when you need to focus on the sequence of steps and decision points within a single process. It's ideal when:
- You need to document a repeatable process that has clear start and end points.
- There are multiple decision points or conditional steps involved.
- You want to standardize procedures across teams or departments.
- You're preparing for audits or compliance checks and need a clear trail of actions.
Choosing the Right Format: Vector Files and Presentation Infographics
If you're planning to use your Process Chart in presentations or digital content, the format matters. Vector files like EPS10 offer scalability without loss of quality, making them perfect for high-resolution printing or digital use. A JPEG preview at 72ppi is useful for quick reference or embedding in slideshows.
Many professionals prefer to work with vector-based Process Charts because they allow for easy editing. If you need to remove a step, change colors, or adjust flow arrows, you can do so cleanly using tools like Adobe Illustrator. This flexibility ensures your chart remains relevant as processes evolve.
Common Considerations Before Creating a Process Chart
Before diving into chart creation, consider the following to ensure your Process Chart is both useful and effective:
- Define the scope: Know the start and end points of the process. Trying to capture too much at once can lead to a cluttered, confusing chart.
- Identify stakeholders: Involve the people who perform the steps. Their insights can uncover hidden complexities or inefficiencies.
- Use consistent symbols: Stick to standard flowchart symbols to avoid confusion. Mixing styles can make the chart harder to interpret.
- Keep it readable: Don't overcrowd the chart with too much detail. If needed, create a high-level overview and support it with more detailed sub-charts.
Strengths and Limitations of Process Charts
Like any tool, Process Charts have their strengths and limitations. Understanding both can help you use them more effectively:
Strengths:- Provides a clear visual of complex workflows.
- Helps identify inefficiencies and redundancies.
- Supports documentation and training efforts.
- Can be adapted for different audiences and purposes.
- Can become overly complex if not well-designed.
- May require updates as processes change over time.
- Less effective for highly dynamic or unpredictable workflows.
- May not capture emotional or human factors in a process.
Getting the Most Out of Your Process Chart
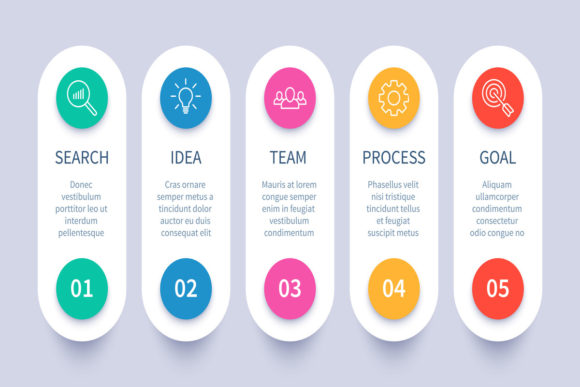
Whether you're using a project finance chart progress steps infographics for a presentation or a detailed process chart for internal documentation, the key is to keep it relevant and user-focused. Start with a clear goal, involve the right people, and use visuals that enhance understanding rather than complicate it.
Remember, a Process Chart isn't just a diagram—it's a communication tool. When done right, it bridges the gap between abstract ideas and actionable plans, helping teams move forward with confidence and clarity.